
2. Why a 'Year in Review' Feature is a Game-Changer!"
Unveiling the Secrets of the Perfect Marriage of Data and Behavioral Science


Year-end is about reflections, which makes it an excellent time for a brand to engage its consumers with a ‘Year in Review’ feature.
It’s a powerful way to personalize your relationship with your customers - to show them that you see them as a unique user. After all, no two humans use a product the same way.

The trend was started by Spotify in 2016 with its annual tradition of Wrapped, and now many other apps have followed - but in my opinion, not enough have. I would love to get such insights from -
1. My bank
-How much money did I save through their promos?
-How many new products have I availed?
- How many times do I put in fresh funds in my account?
-If I have a payroll account, it would be so cool if the bank could tell me what products ‘other employees like you’ availed

2. My grocery or e-commerce store
Total money spent on fresh veggies and protein per week
Products I purchase more than five times or only once
Monthly basket analysis
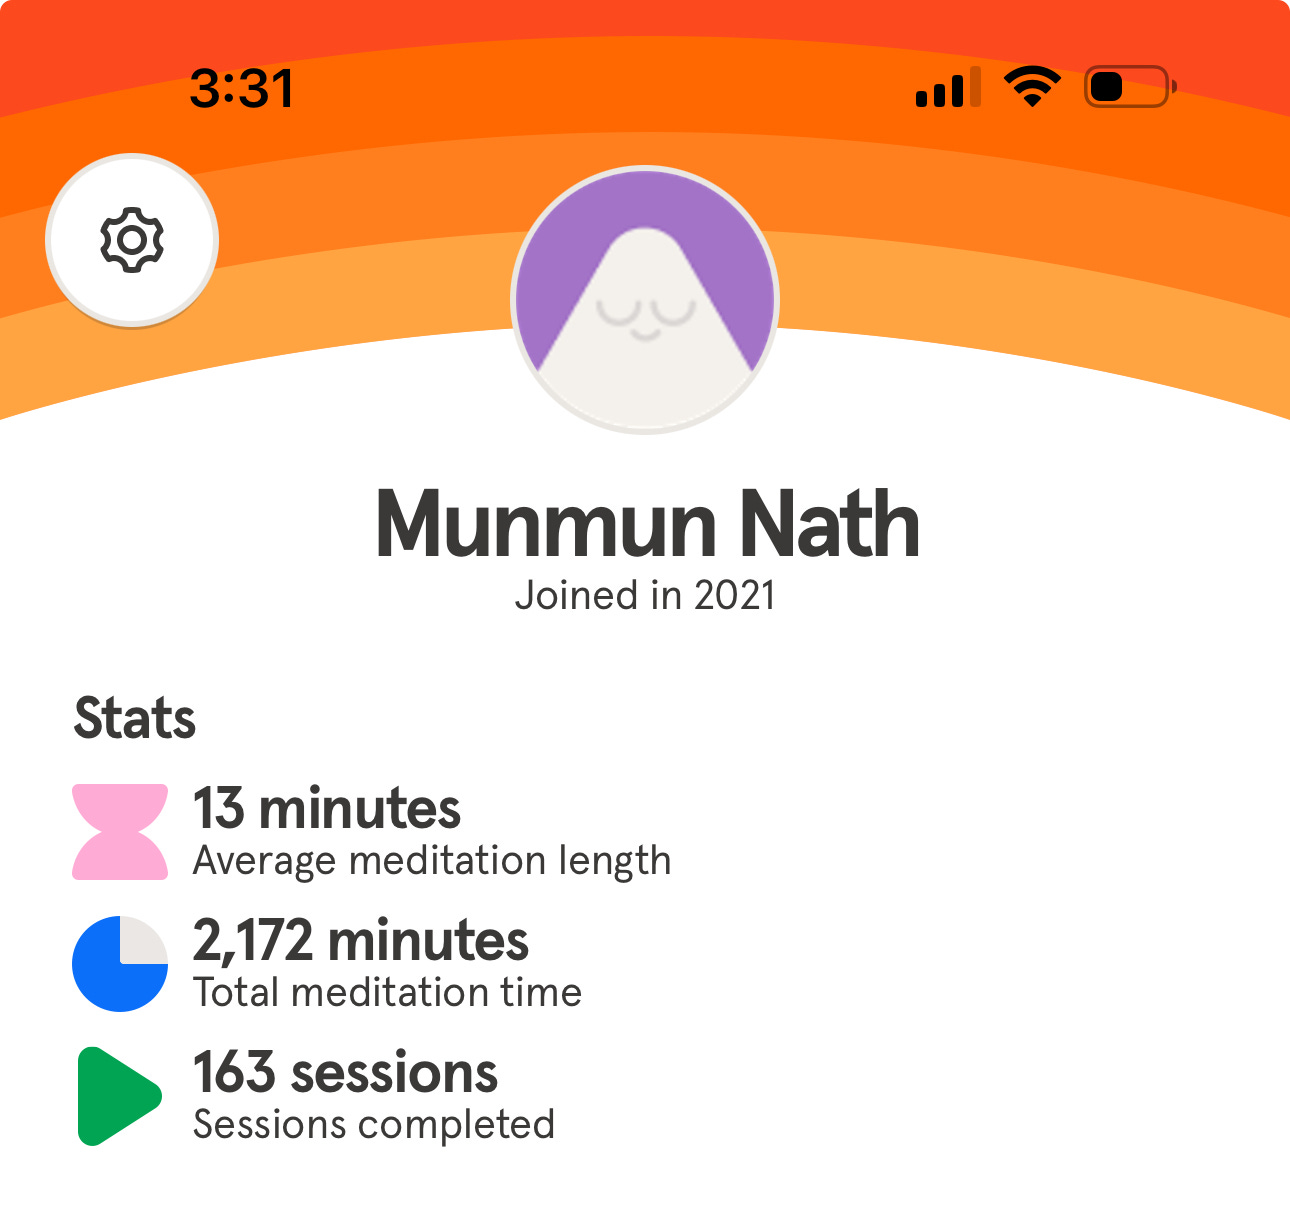
3. My meditation app
I use Headspace, which has a very limited view of how I use the app. It could enhance my engagement by showing -
Monthly meditation trend
Weekdays and times when I meditate most
Types of meditations I love
As you can see from these examples, the Year in Review feature is an opportunity to generate aha moments - golden nuggets of insights for both the brand and its users by marrying behavioral science with data science.
Just as our reflections tell us what went well and what could be better, doing a ‘year in review’ analysis among various segments can help a brand better understand seasonality and monthly trends in consumer behavior -
How do users interact with a product over time?
What features are frequently most used and which are not used?
What content was most engaging, and during what time?
Heaviest and lightest users and correlation between frequency and value

Presenting this information visually to users could act as powerful behavioral nudges -
Seeing achievements and milestones could motivate users to set goals for the future and engage more with the product.
A well-crafted 'Year in Review' can evoke nostalgia, happiness, or motivation - and such emotions can strengthen their emotional connection to the product, leading to higher mental availability of the brand.
It can encourage them to share their 'Year in Review' with others, serving as social proof and potentially attracting new users to the product.

What role does data science play in creating this feature?
Here is a high-level breakdown of the steps involved -
Targeted Data Collection and User Interaction Analysis:
Collect data most relevant to user interactions within the app, such as screen time on different sections, frequently used features, etc.
Behavioral Analysis and User Engagement Insights:
Analyze this data to identify the most engaging features to understand how user interaction evolved.
Personalized Summary Creation:
Include top activities, most engaged content, and a timeline of the user's journey with the app over the year. Use natural language generation techniques to create personalized narrative summaries.
Predictive Modeling for Future Engagement:
Develop models based on the past year's data to predict future user behavior. This can provide users with personalized recommendations or insights for the upcoming year.
Engaging and Interactive Data Visualization:
Design the 'Year in Review' feature with user-friendly visualizations, such as interactive graphs, heat maps of activity, and personalized infographics.
Ensure the visualizations are mobile-friendly and easily shareable on social media platforms to enhance user engagement and virality of the feature.
Finally, a well-done Year in Review, such as Monzo’s, is a marketer’s dream because it can provide fantastic material for new creative, data-driven campaigns and product ideas.
Are there any other examples of brands that do a great ‘year in review’? Please share in the comments below.
