
16. How to predict the outcome of marketing actions?
The answer is Regression analysis - the powerful tool that helps you uncover relationship between variables.

This newsletter aims to help you better understand your customers using behavioral and data science.
Data science is an umbrella term comprising two main components - statistics and machine learning.
In statistics, there are 3 essential concepts to understand -
A/B Testing and Hypothesis Testing
Regression Analysis
My newsletters on the first two topics are linked above. This week, I am focusing on Regression Analysis, a powerful tool for uncovering relationships between variables.
Regression analysis can help you predict the outcome of specific marketing actions based on historical data. For example, you can use regression to understand how changes in marketing spend will affect sales or how different demographics respond to your campaigns. Therefore, Regression Analysis can help you allocate spending, optimize tactics, and achieve better results.
Here are some ways it helps us gain insights:
Understanding Relationships: Which product features impact customer satisfaction the most? The analysis helps us identify and quantify such relationships.
Predicting Customer Behavior: What % of our customer base could churn? What is the likelihood of a customer buying a product?
Segmentation: Which demographic groups are more likely to respond positively to a marketing campaign? The analysis can help segment customers based on their responses to different variables.
Evaluating Trends Over Time: How are customer preferences changing? Regression models can analyze trends over time.
Data science teams at most companies would use regression models for business decision-making. Here are a few examples -
An e-commerce platform uses regression to predict which products will likely be popular among customer segments. This enables it to stock products more efficiently.
A subscription-based streaming service provider uses regression analysis to analyze viewer habits, ratings, and preferences to personalize content recommendations, thereby increasing viewer engagement and subscription renewal rates.
A shoe manufacturer employs regression analysis to understand the impact of various marketing strategies on sales performance. This allows the company to allocate its marketing budget more effectively and design products that meet the evolving preferences of its target market.
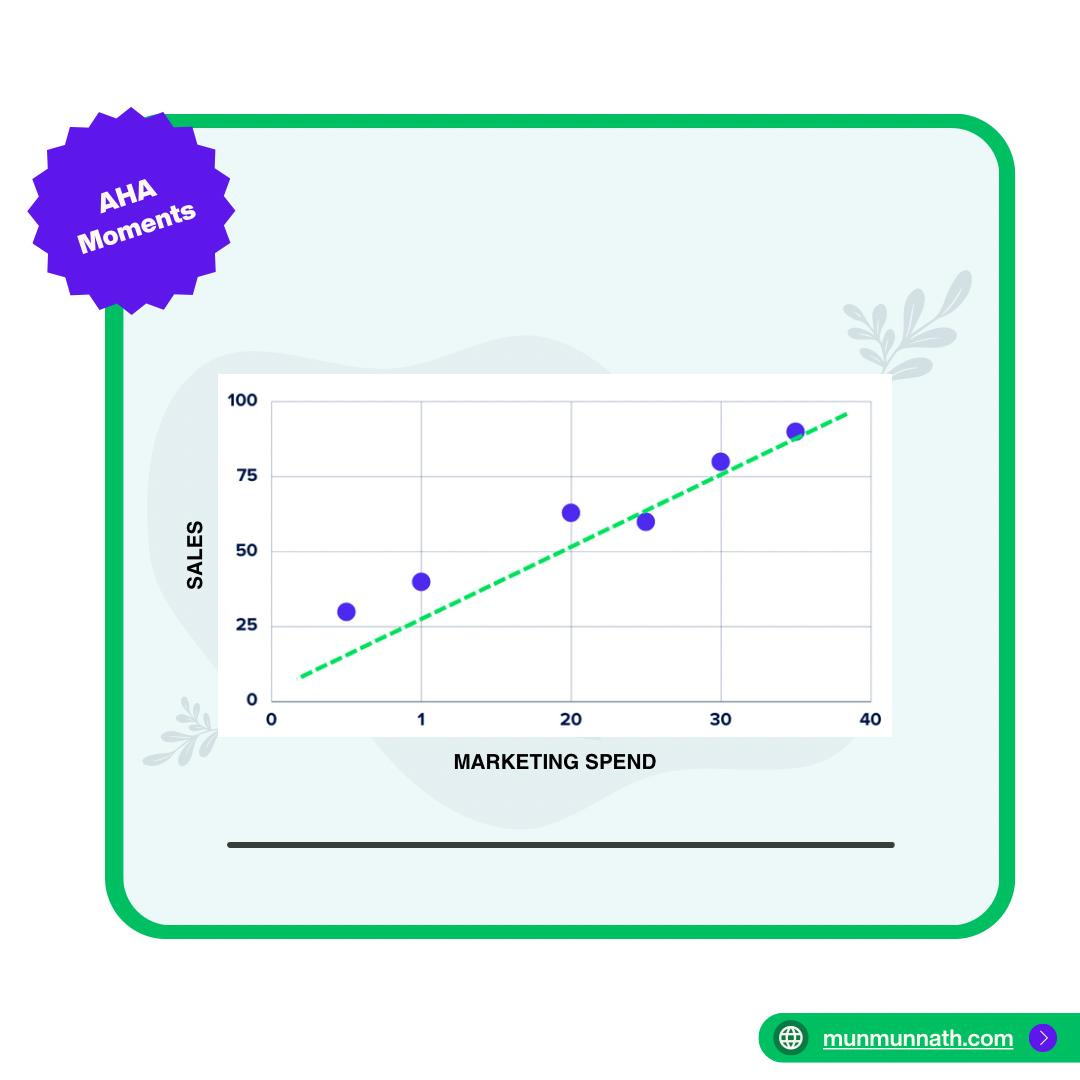
A typical marketing use case is forecasting sales based on the marketing budget.
To conduct this forecast, you need historical data depicting marketing spending over a certain period. Mathematically, the monthly marketing spend is the independent variable or X value, and the dependent variable is the number of sales per month or Y value.
I created the data set below to represent monthly marketing spend and the corresponding number of sales over 12 months.

So, the overall regression equation is Y = bX + a, where:
X is the independent variable (marketing spend)
Y is the dependent variable (sales)
b is the slope of the line
a is the point of interception, or what Y equals when X is zero
Using Google Sheets, I got the following X-Y scatter chart with a regression line and equation. The slope of the line indicates the degree of relationship. Here, the line is almost flat, indicating a weak impact of marketing spend on sales. If the slope of the line is upwards, it would suggest that increasing spending would increase sales, and a downward line would indicate the reverse.

This is a very simple example of a linear regression. In reality, multiple factors impact sales, and these factors could be modeled using more complex methods, such as multivariate regression.